
After all the other network enhancements I have been working on, it was time to get some centralized logging going on. While I considered Logging Made Easy (LME) from CISA - this looked like just an abstraction on top of the ELK stack. Since I already had implemented that years ago, I elected for the latter and the die was cast.
It's been almost a decade since I first toyed with an ELK stack under CentOS 6 and 7 so I knew this would be a do-over, but I was not ready for all the bumps and turns it would end up taking...
First. MY BAD! I made the classic blunder, Not of getting involved in a land war in Asia... but the slightly less known, of blindly following an Internet tutorial! In my case specifically failing to notice the number 7!
Allow me to explain - BE VERY SPECIFIC before you read the following, please confirm the current version of the elastic stack and update these notes for that version (speaking from experience)
I started by looking at the following article: https://vegastack.com/tutorials/how-to-install-elk-stack-on-ubuntu-22-04/
This was written when versions 7.x was the current elastic stack version. (and thank goodness it is no more, because that version and security were strange bedfellows!)
Cutting a long story short - after struggling for over a week to make version 7.x work, I finally realized version 8.x was out and on switching to that - instantly the world was open to me.
So, let's start there!
First, To be clear this is all related to a fresh install of the elastic stack on Ubuntu 22.04 for Elastic Stack 8.x (current as of this writing) which, I might add is MUCH MUCH MUCH MUCH better than 7.x - just saying!
System Specs: I hate to say this but it really depends - if you're tracking 2 hosts or 2000 hosts things are going to be very different. My VM based stack is collecting stats from about 10 hosts so it's pretty small. I have 16GB RAM and 128GB HG space to start but I expect I'll need to expand that and I have the room to do so.
First, we need to add the Elastic repo's GPG key to the system:
curl -fsSL https://artifacts.elastic.co/GPG-KEY-elasticsearch |sudo gpg --dearmor -o /usr/share/keyrings/elastic.gpg
Then (note the version number here) we add the elastic repo:
echo "deb [signed-by=/usr/share/keyrings/elastic.gpg] https://artifacts.elastic.co/packages/8.x/apt stable main" | sudo tee -a /etc/apt/sources.list.d/elastic-8.x.list
As usual, start things off with a swift kick to the system (make sure you're up to date):
sudo apt updatesudo apt upgrade
Then we can install elasticsearch and kibana from the new repo:
sudo apt install elasticsearchsudo apt install kibanasudo apt install nginx
I'm using Nginx to act as a proxy for the cluster.
What, no Logstash?
So, this took a bit more research. Coming from my past experiences, I expected a complete ELK stack - Elasticsearch + Logstash + Kibana. However, over the years Logstash has faded somewhat and is no longer necessary in many cases. This took a surprising amount of research to uncover since so many online resources are outdated and assume it is a required component. That said, there are some cases where you may still want Logstash to act as an intermediary and pre-process logs before they are fed into elasticsearch, but these are few and far-between and I'm not going to get into those cases. In most cases you no longer need it.
This is what it looks like now:
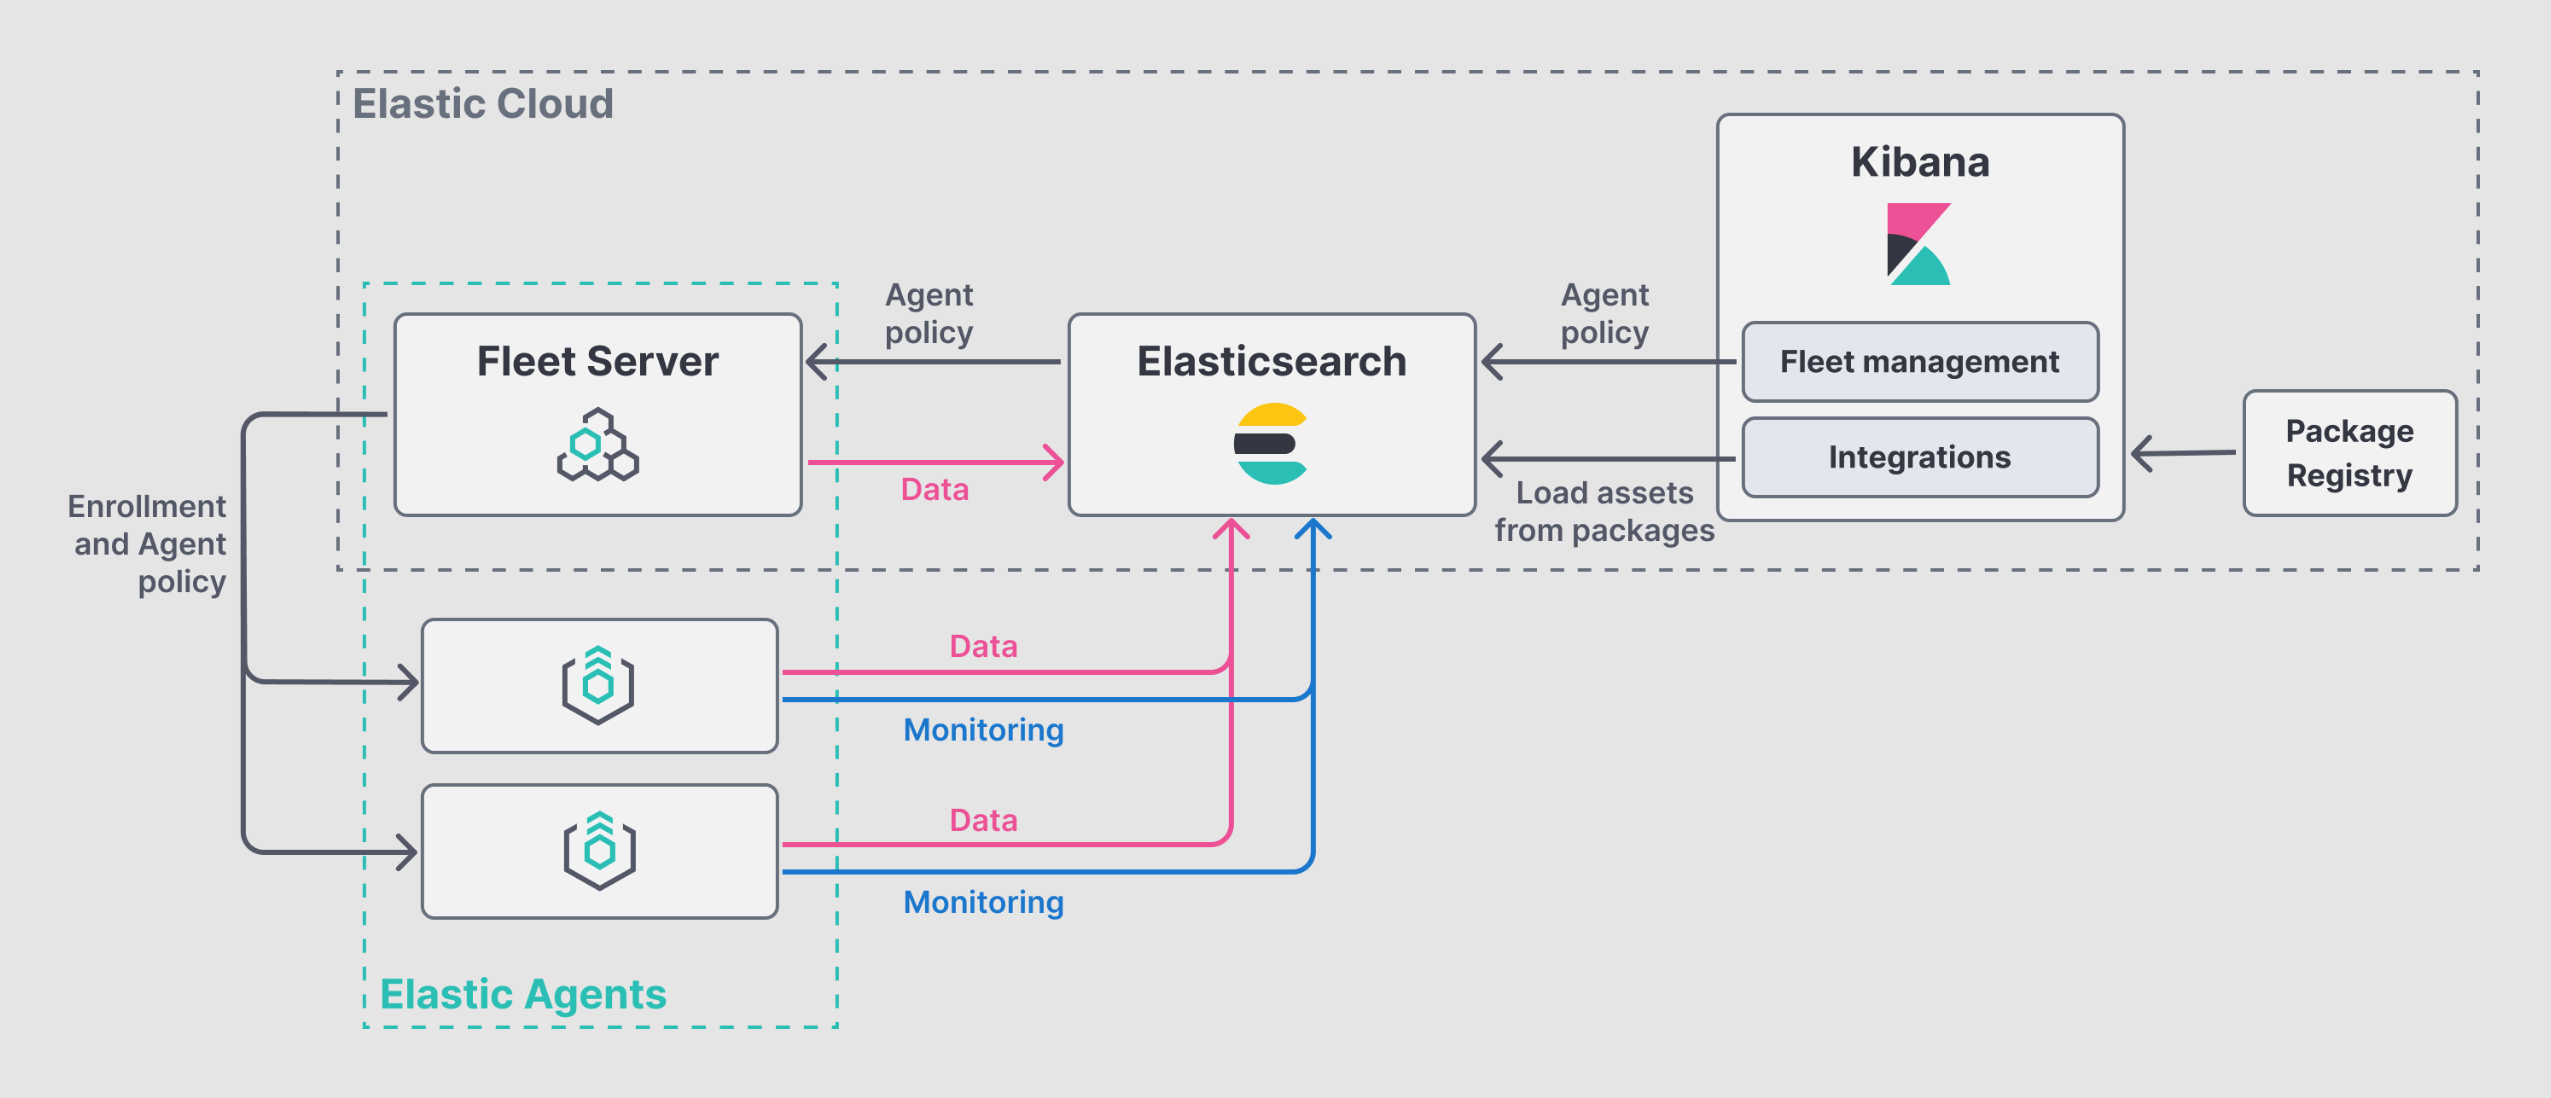
Fleet Server is basically an orchestration platform that allows you to send out configuration to the various Elastic Agents you have deployed. The Fleet Server is an Elastic Agent itself but it has been configured with specific settings to mark it as a Fleet server. Elastic Agents replace all the "beats" from the past. These agents can act as filebeat, metricbeat, or any other beat agents. This dramatically simplifies elastic deployments.
Your setup may vary but in my case elasticsearch, kibana, and the fleet server are all on the same node. Not recommended for larger implementations but with my few nodes this 'hopefully' will be fine.
Confirm Elasticsearch
So to start, let's confirm elastiscearch is working:
curl -X GET "localhost:9200"
you should get something that looks like (and yes I fuzzed the hash and uuid):
{ "name" : "hostname.example.com", "cluster_name" : "MyClusterName", "cluster_uuid" : "AzePUc2Pkjnt6ekqSkz", "version" : { "number" : "8.11.1", "build_flavor" : "default", "build_type" : "deb", "build_hash" : "1f9ff581fbade221e6f69d6ce04460f060d8fa0b", "build_date" : "2023-11-11T10:05:59.421038163Z", "build_snapshot" : false, "lucene_version" : "9.8.0", "minimum_wire_compatibility_version" : "7.17.0", "minimum_index_compatibility_version" : "7.0.0" }, "tagline" : "You Know, for Search"}
Kibana Next
Since Kibana finally has a built-in user authentication system I do not recommend setting up nginx with basic-auth but I do recommend setting it up to upgrade the connection to https.
So, that means my nginx conf for this site will look something like this (assuming you have certificates and private key already set in defaults for nginx):
server { listen 80; server_name hostname.example.com; return 301 https://hostname.example.com;}
server { listen 443 ssl;
server_name hostname.example.com;
location / { proxy_pass http://localhost:5601; proxy_http_version 1.1; proxy_set_header Upgrade $http_upgrade; proxy_set_header Connection 'upgrade'; proxy_set_header Host $host; proxy_cache_bypass $http_upgrade; proxy_set_header X-Forwarded-For $proxy_add_x_forwarded_for; proxy_set_header X-Real-IP $remote_addr; }}
Securing Communications
To use the Elastic Agent and Fleet server approach, you will still need to setup certs for Elasticsearch, Elastic Agent and Kibana internal communications. This is usually done using the included helper script "elasticsearch-certutil" You will find this and other handy tools located (this took some hunting because all the docs point to other places!) in:
/usr/share/elasticsearch/bin
A word of warning here. Pay VERY close attention to the requirements of each config file. Some of them want a cert+key package in p12 (single binary) format and others want separate cert and key in pem (base64 encoded text) format. Why are they not consistent you might ask??? I know I did!
You're going to create a certificate authority and several certs. I recommend you create all of them in both formats so you can be ready to specify the different formats where they are needed.
I placed everything in a single folder for easy access (just watch the permissions so it's only accessible by root)
/etc/elasticsearch/certs
First create the certificate authority
/usr/share/elasticsearch/bin/elasticsearch-certutil ca
Name the output file ca.p12 when asked.
To extract the p12 file into pem format you can use openssl
sudo openssl pkcs12 -in <path to>ca.p12 -out /etc/elasticsearch/certs/ca.crt -clcerts -nokeyssudo openssl pkcs12 -in <path to>ca.p12 -out /etc/elasticsearch/certs/ca.key -nocerts -nodes
You will use this certificate authority to sign all the certificates you create and specify it as a trusted authority. This allows you to use internal self signed certificates without errors.
Now use this CA to generate signed certificates for Elasticsearch, Kibana, and Fleet Server. I believe the easiest is to generate these in p12 format using the helper script and then use openSSL to create the pem format files:
Be sure to specify both the DNS and any local IPs that may be used to connect (including localhost, 127.0.0.1, and non-local IP and dns addresses)
EG for Kibana:
/usr/share/elasticsearch/bin/elasticsearch-certutil cert \--name http \--dns host.example.com,localhost \--ip <my ip>,127.0.0.1 \--ca /etc/elasticsearch/certs/ca.p12 \--out /etc/elasticsearch/certs/http.p12
Then:
sudo openssl pkcs12 -in /etc/elasticsearch/certs/http.p12 -out /etc/elasticsearch/certs/http.crt -clcerts -nokeys
sudo openssl pkcs12 -in /etc/elasticsearch/certs/http.p12 -out /etc/elasticsearch/certs/http.key -nocerts -nodes
EG for Elasticsearch:
/usr/share/elasticsearch/bin/elasticsearch-certutil cert \--name elasticsearch\--dns host.example.com,localhost \--ip <my ip>,127.0.0.1 \--ca /etc/elasticsearch/certs/ca.p12 \--out /etc/elasticsearch/certs/elasticsearch.p12
sudo openssl pkcs12 -in /etc/elasticsearch/certs/elasticsearch.p12 -out /etc/elasticsearch/certs/elasticsearch.crt -clcerts -nokeyssudo openssl pkcs12 -in /etc/elasticsearch/certs/elasticsearch.p12 -out /etc/elasticsearch/certs/elasticsearch.key -nocerts -nodes
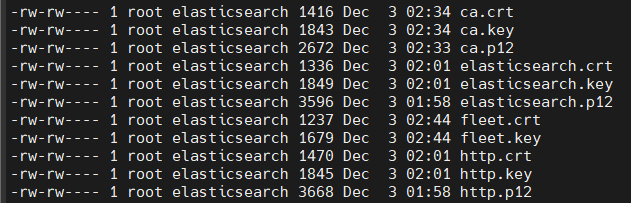
Fleet server doesn't need the p12 format so I didn't so it the same way but it's probably easier to just to them all this way. Your final output would then look like mine with the addition of a fleet.p12 file.
Files in /etc/elasticsearch/certs/
Generate Passwords
You need to generate passwords for the built-in accounts for elasticsearch, kibana, etc... Again, there is a helper provided for this. It will automatically generate and set the passwords for each system account and print them to the screen ONE TIME. be sure to make note of all the generated passwords for each of the built-in users.
/usr/share/elasticsearch/bin/elasticsearch-setup-passwords --auto
I have not shown the output since it should be self-explanatory and mine would need to be all redacted anyway.
Set up the config files
Now that you have all the certs - you need to set up the various config files:
sudo vi /etc/elasticsearch/elasticsearch.yml
Add the following:
xpack.security.enabled: truexpack.security.authc.api_key.enabled: truexpack.security.transport.ssl.enabled: truexpack.security.transport.ssl.verification_mode: nonexpack.security.transport.ssl.client_authentication: nonexpack.security.transport.ssl.keystore.path: "/etc/elasticsearch/certs/ca.p12"xpack.security.transport.ssl.truststore.path: "/etc/elasticsearch/certs/ca.p12"xpack.security.http.ssl.enabled: truexpack.security.http.ssl.keystore.path: "/etc/elasticsearch/certs/http.p12"xpack.security.http.ssl.truststore.path: "/etc/elasticsearch/certs/http.p12"xpack.security.http.ssl.verification_mode: none
Eventually the ssl.verification_mode should be "certificate" but I have yet to get this working. Since my install is on a small, personal, local network. I'm comfortable with none for now. But this is not suitable for any sort of production implementation. Once done restart elasticsearch:
sudo systemctl restart elasticsearch
Next setup Kibana:
sudo vi /etc/kibana/kibana.yml
and ensure the following lines are not commented and updated (note the need for pem format certs here:
elasticsearch.hosts: https://host.example.com:9200elasticsearch.ssl.certificateAuthorities: [ "/etc/elasticsearch/certs/ca.crt" ]
elasticsearch.username: "kibana_system"elasticsearch.password: "<your generated password>"
Once that is done:
sudo systemctl restart kibana
At this point you should (finally) be able to access Kibana through a web browser by https://hostname.example.com assuming you have set up everything correctly. If you're not getting to it - check the log files. There are several you may need to check including:
/var/log/elasticsearch/<your server name>.log/var/log/elasticsearch/elasticsearch.log/var/log/kibana/kibana.log
Assuming it works proceed to get your Fleet Server enrolled.
Fleet Server
The fleet server will control all your agents. It's a great system that allows central administration of all the agents and you can push out configs to these agents from the central server. In a larger environment you would want a standalong server for this, but in my case I'm just keeping it on the same VM.
Fleet server is just a specially configured Elastic Agent so that's all you need to install the agent. To allow better central management - install your agent from the elastic tar file directly rather than a deb package. NOTE THE VERSION HERE these URLS come from within Kibana - use the one specified for your version!
curl -L -O https://artifacts.elastic.co/downloads/beats/elastic-agent/elastic-agent-8.11.1-linux-x86_64.tar.gztar xzvf elastic-agent-8.11.1-linux-x86_64.tar.gzcd elastic-agent-8.11.1-linux-x86_64
Kibana will also give you a Service Token in the web interface, Update the following for your hostname and token:
sudo ./elastic-agent install --url=https://hostname.example.com:8220 \ --fleet-server-es=https://hostname.example.com:9200 \ --fleet-server-service-token=<your service token> \ --fleet-server-policy=fleet-server-policy \ --fleet-server-port=8220 \ --certificate-authorities=/etc/elasticsearch/certs/ca.crt \ --fleet-server-es-ca=/etc/elasticsearch/certs/ca.crt \ --fleet-server-cert=/etc/elasticsearch/certs/fleet.crt \ --fleet-server-cert-key=/etc/elasticsearch/certs/fleet.key
Again, if everything works - you should see the Fleet Server enrolled in Kibana. If there is an issue, check the same logs as before and also check the logs in:
/var/log/elastic-agent/
Filenames here are date-stamped.
At this point, if everything is working you should see log data from the Elasticsearch server itself in Elasticsearch and kibana. if you don't, I'd keep trouble shooting until you do.
Remote Agents
You're almost there... Finally we need to add agents to any hosts in the network we want to monitor. After all the previous setup this is the easy part - especially now with fleet server and Elastic Agents.
All you need to do is install Elastic Agent as you did before (same commands as for the Fleet Server) and enroll it as an agent.
curl -L -O https://artifacts.elastic.co/downloads/beats/elastic-agent/elastic-agent-8.11.1-linux-x86_64.tar.gztar xzvf elastic-agent-8.11.1-linux-x86_64.tar.gzcd elastic-agent-8.11.1-linux-x86_64
Copy over the ca.crt to the server (I suggest into /etc/elastic-agent/certs/ca.crt) Then enroll:
sudo elastic-agent enroll \--url=https://hostname.example.com:8220 \--certificate-authorities=/etc/elastic-agent/certs/ca.crt \--enrollment-token=<token from kibana (not the fleet one)>
One more note, if you have a trust-no-one network (which of course you do) be sure to allow port 8220 from any remote host back to the Elasticsearch server for communications to work.
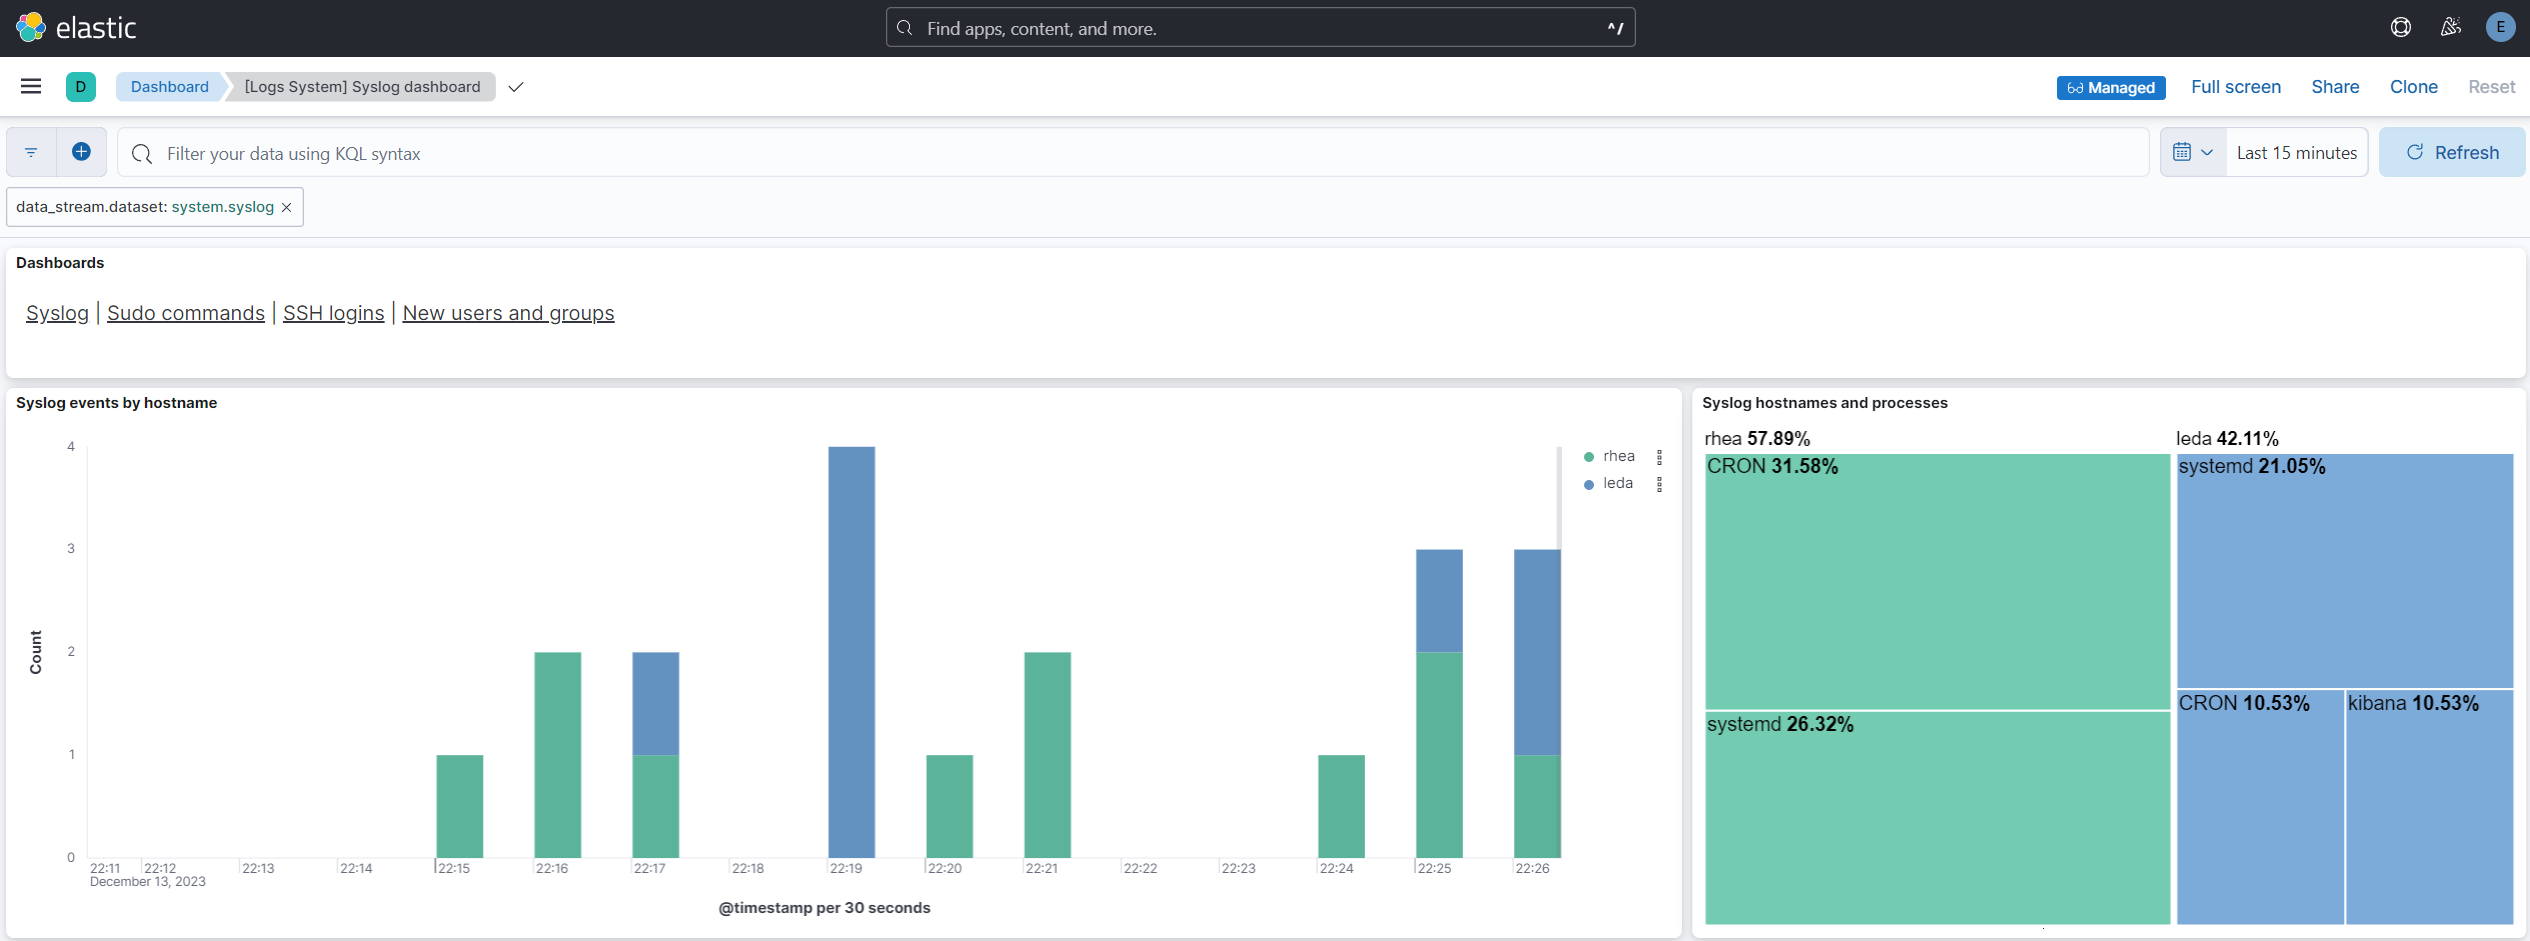
If you got this far you SHOULD have Kibana visualizing data from all the hosts you added. I plan to post more later about how to set up the dashboards in Kibana, but this was already enough for one session!